
[ad_1]
Materials and imaging acquisition
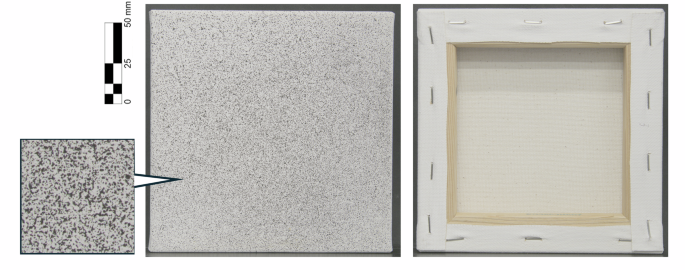
Two 15 × 15 cm blank cotton canvas panels, mounted on 2 cm stretcher bars and primed three times with gesso, were purchased from Sostrene Grene, a general art supply retailer (Stable Street, London, UK). The mock-ups are intentionally simplified and scaled down, focusing on the primed canvas-stretcher system and are designed to capture the core structural and compositional features shared by a large proportion of real canvas paintings. They were then patterned with random speckles using acrylic spray paint to create a suitable speckle pattern for DIC, as shown in Fig. 1. The optimum pattern feature size for DIC is typically 3–5 pixels, and a balanced black-white coverage of approximately 50% is commonly recommended to promote stable correlation performance27.

Front and back views of the mounted canvas are presented, together with a close-up of the applied speckle pattern. The front view shows the high-contrast black-and-white pattern used for Digital Image Correlation (DIC) analysis. The back view illustrates the wooden stretcher frame over which the canvas was stretched. The close-up highlights the random speckle distribution that enables full-field displacement and strain measurements through image correlation.
The two canvases were humidified at 70 °C and 80% RH for 10 h in a climate chamber (ClimeEvent C/180/40/5, Weiss Technik) while laid flat. After humidification, they were transferred to a laboratory at room temperature conditions of 19 °C and 30% RH, where one canvas was positioned horizontally and the other vertically for image acquisition.
To demonstrate the applicability of this approach in low-resource museum settings, a commercial DSLR camera (Nikon D7500 with AF-S NIKKOR 24–120 mm f/4G ED VR lens) was used instead of a scientific-grade CCD camera, which is more commonly employed in DIC. The camera was mounted on a tripod, with additional illumination provided by an LED ring light. The optimal imaging configuration was determined as follows: (1) a low ISO setting (ISO = 100) to minimise noise and enhance image sharpness, (2) an aperture range of f/6.3 to f/11 to achieve an adequate depth of field, and (3) a fast shutter speed of 1/50 s with the use of a remote shutter release to prevent motion blur.
Five consecutive photographs were captured immediately after the canvas was removed from the climate chamber. Subsequently, five additional photographs were acquired at the beginning of each minute for 30 minutes as the panel dried under ambient conditions, yielding a total of 150 photographs. After an additional two hours, once a steady state with the room environment had been reached (i.e., a quasi-equilibrium condition characterised by stabilised mass and surface temperature, monitored using a digital scale and a handheld infra-red thermometer (FLIR MR77), respectively, with negligible moisture and heat exchange with the surrounding environment on the timescale of image acquisition), five further photographs were taken and used as the reference set. This waiting period represents a pragmatic compromise: while ensuring the absence of rapid moisture exchange, it avoids prolonged image acquisition that would otherwise increase temporal DIC noise arising from sensor readout, thermal drift, and illumination variability. The steady state adopted here, therefore, provides an appropriate reference condition for the subsequent DIC analysis. To preserve image quality, the photographs were converted to uncompressed TIFF format prior to processing with Ncorr.
Ncorr software for DIC analysis
The MATLAB-based open-source 2D-DIC software Ncorr26, was selected for image processing. The working principle of DIC is based on tracking the movement of features on the surface of an object through a series of digital images28. The process is simple: a series of images undergoing deformation is taken, consisting of a reference image (in most cases, the initial image before the object deforms) and subsequent images, which are then processed by correlation analysis. The reference image is divided into many small, overlapping subsets, each representing a local interrogation window containing a distinctive speckle intensity pattern on the object surface. During DIC analysis, the algorithm searches for the most similar intensity pattern in subsequent images, allowing the displacement of each subset centre to be determined. Spatial differentiation of these subset-level displacements is then used to calculate the deformation (strain) field.28,29.
While Ncorr provides reasonable accuracy, it is highly sensitive to noise and requires careful calibration and manual parameter tuning. After trial and error optimisation, the analyses here were performed using a subset window radius of 40 pixels, an overlap of 20 pixels, and a strain window radius of 15 pixels. A region of interest (ROI) slightly smaller than 150 × 150 mm was selected to exclude the canvas edges from the analysis. For the deformation measurements, the image acquired at the onset of drying was selected as the reference image, and all subsequent images recorded during the drying process were correlated to this initial reference. This approach was adopted to provide a clearer and more intuitive visualisation of the deformation evolution.
Uncertainty and signal-to-noise calculation
In conventional DIC and Ncorr workflows, the noise level of the strain field is commonly assessed prior to the application of external loads to the specimen27. Such a procedure is not applicable in the present study, as the humidification protocol requires transfer of the canvas into and out of a climate chamber. The associated handling and repositioning introduce apparent displacements that are comparable in magnitude to the actual hygroscopically induced deformation of the canvas. Consequently, the noise level was evaluated after the deformation had stabilised, once the canvas had reached a steady state, and this stabilised condition was used as the reference set for uncertainty estimation.
Measurement uncertainty in DIC arises partly from stochastic noise inherent to the camera sensor, which varies between successive exposures even under nominally identical imaging conditions. In addition, Ncorr employs subpixel interpolation to estimate displacement fields, and these subpixel displacements propagate into strain calculations, producing small but non-zero strain values in the absence of true deformation. The magnitude of this intrinsic noise depends on the subset size, correlation parameters, and image quality, and together these contributions define the inherent noise floor of the DIC measurement. Noise characteristics and bias effects in DIC have been extensively investigated in the literature30.
In the present work, the reliability of the proposed measurement approach is assessed using an alternative strategy adopted from previous studies27,31,32, in which the signal-to-noise ratio (SNR) and coefficient of variation (CV) are employed as quantitative performance indicators. As Ncorr employs a subset-based formulation, displacement is estimated at each subset by optimising a correlation criterion, and strain fields are subsequently obtained by spatial differentiation of the subset-centred displacement field. Accordingly, both measurement uncertainty and SNR are evaluated at the subset level, ensuring consistency with the DIC analysis’s underlying kinematic formulation.
Under steady-state conditions, the measurement uncertainty (noise) of the DIC strain fields is therefore quantified on a per-subset basis. For each subset i and for each strain component εxx, εxy, and εyy, the standard deviation across the reference images was computed as
$${\sigma }_{i}=\sqrt{\frac{1}{{N}_{{\rm{img}}}-1}{\sum }_{k=1}^{{N}_{{\rm{img}}}}{\left({\varepsilon }_{i}^{k}-{\overline{\varepsilon }}_{i}\right)}^{2}},$$
(1)
where Nimg denotes the number of images acquired under the stabilised condition, \({\varepsilon }_{i}^{k}\) is the measured strain at subset i in image k, and \({\overline{\varepsilon }}_{i}\) is the mean strain at that subset.
While system-averaged noise or signal-to-noise ratio metrics are widely adopted in the literature as global indicators of DIC performance27,32, they do not explicitly account for the fact that noise characteristics are spatially heterogeneous and depend on local speckle quality and subset information content33. As a result, such metrics may obscure local variations in measurement resolvability. In contrast, the present study adopts a per-subset noise normalisation, whereby the deformation signal at each subset is normalised by its own locally estimated noise floor.
Accordingly, instead of spatially averaging the standard deviations over all subsets within the region of interest (ROI), the per-subset uncertainty Usub,i is defined to represent the local noise floor at each subset i:
$${U}_{{\rm{sub}},i}={\sigma }_{i}$$
(2)
For each deformation time point, the absolute strain at each subset i was averaged over the five images acquired at that time point to obtain a per-subset estimate of the signal magnitude:
$${\overline{| \varepsilon | }}_{\mathrm{sub},i}=\frac{1}{{N}_{\mathrm{img}}}\mathop{\sum }\limits_{k=1}^{{N}_{\mathrm{img}}}| {\varepsilon }_{\mathrm{sub},i}^{(k)}| .$$
(3)
The signal-to-noise ratio (SNR) was then calculated on a per-subset basis using a per-subset noise normalisation as
$${{\rm{SNR}}}_{{\rm{sub}},i}=\frac{{\overline{| \varepsilon | }}_{{\rm{sub}},i}}{{U}_{{\rm{sub}},i}},$$
(4)
where \({\overline{| \varepsilon | }}_{{\rm{sub}},i}\) represents the mean absolute strain magnitude for subset i at the analysed deformation time point, and Usub,i denotes the corresponding steady-state noise floor for the same subset.
Mapping SNRi across the region of interest yields a spatially resolved visualisation of the local reliability of the strain measurements, as shown in Fig. 2. This subset-based formulation accounts for non-uniform noise distributions (e.g., due to edge effects, lighting variations, or local speckle quality) and enables objective thresholding (e.g., SNR≥3) to delineate regions where the measured strain signal is significantly greater than the local noise floor.

a A selected region of interest (ROI) on the speckled canvas surface is partitioned into subsets that serve as correlation units for full-field strain evaluation using Digital Image Correlation (DIC). b To determine the deformation signal at a given time point, strain fields are computed from five consecutively acquired images and averaged locally at each subset position to reduce frame-to-frame variability. c Measurement noise is estimated separately under steady-state conditions by calculating the local standard deviation of strain across five consecutive images at each subset location. d The signal-to-noise ratio (SNR) is calculated at each subset as the ratio between the averaged strain magnitude and the corresponding local standard deviation. The resulting values are spatially mapped to visualise measurement reliability within the region of interest.
The CV provides a dimensionless measure of the relative variability of the signal and is expressed here as the inverse of the per-subset signal-to-noise ratio:
$${{\rm{CV}}}_{i}=\frac{1}{{{\rm{SNR}}}_{i}}\times 100 \% .$$
(5)
[ad_2]
Source link