
[ad_1]
Optical microscopy
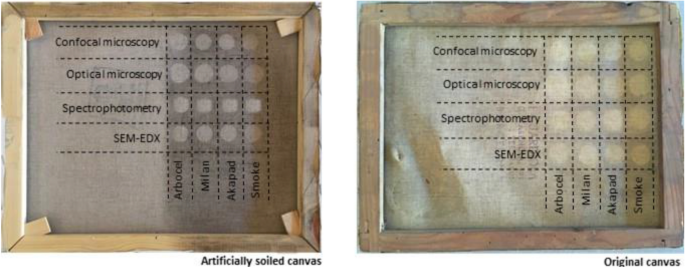
Artificially soiled canvas samples
In the new canvas, images were taken at 60 and 200 magnifications of the same cleaned sample, soiled with artificial dirt and cleaned with the four cleaning techniques tested, in order to establish whether they remove the artificial dirt and modify the texture by removing the canvas fibres, and/or whether residues of particles of the cleaning materials are observed.
The images in the first column in Table 2 show the untreated, unsoiled reverse of the painting. The white coating layer can also be seen between the weft and the warp. The image at 60 × shows that originally the threads were not perfectly twisted and that some fibres were slightly raised and disordered. The images in the second column reinforce this idea, once the sample has been impregnated with artificial dirt.
The third column shows the result of each cleaning test. No significant displacement of fibres were observed by using optical microscopy at × 60 and × 200, a magnification range usually performed while cleaning treatments are carried out. However, as shown in the next sections -especially in SEM–EDX results and CLM-, higher magnifications are required to explore this further. Dirt was removed without leaving almost any residue by using Arbocel® powdered microblasting and Art Sponge. In contrast, some black particles of soil remaining on and between the canvas were identified in the samples cleaned with Milan® eraser and Akapad® Soft.
Old canvas samples
The results of the old canvas cleaning tests are shown in Table 3. For each cleaning technique, the spot is presented before and after cleaning in which dirt residues of particles can be detected, when present, as well as the residues of particles of the cleaning materials.
The dry-cleaning technique with the best results is microblasting with powdered cellulose, as canvas is free of residues of particles, both from the cleaning material and from the dirt.
In contrast, the spots cleaned with Milan® eraser and Akapad®Soft sponge contain some dirt particles and a large amount of residues from the rubber, trapped between the fibres of the canvas and the gaps between the weft and the warp. The spot cleaned with the Art Sponge® also presents some dirt residues, although fewer cleaning material residues were identified.
Regarding the morphology of the cleaned spot surface, some changes are observed in the canvas cleaned with dry traditional techniques. After cleaning, fibres are quite disordered and somewhat deteriorated (folded and broken) (see column 3 of Table 3). In contrast, microblasting with powdered cellulose kept the original texture of the canvas, resulting in a better twisted thread.
SEM–EDX
Scanning electron microphotographs of the uncleaned and cleaned samples were studied to evaluate possible changes to the fibres at high magnification.
In addition, the main elemental composition of the canvas samples was studied by EDX analysis in order to identify chemical elements related to possible particles of residues from the cleaning agents or artificial soiling in the treated samples. Thus, EDX results of the different cleaned spots were compared with the EDX microanalyses of the cleaning agents and artificial soiling (Table 4).
Cleaning materials and artificial soiling
By means of EDX microanalysis, the main chemical elements present in the four cleaning materials and the artificial soiling were identified, obtaining 10 spectra of a flat sample 4 mm in diameter (Table 4). Although some of the elements are present in both cleaning systems, soiling and/or substrate, combination of this information with SEM visualization of particles in samples enabled to detect possible remaining residues after the cleaning treatment.
In the case of Arbocel®, since it is composed of cellulose (C6H10O5), only C and O appear prominently in the EDX spectra. As this is also the main component of canvas, in the case some soiling particles would remain after the cleaning treatment, they would be easily identified by EDX. Evaluation of possible residues of Arbocel® in the canvas after the treatment was undertaken by SEM visualization, as morphology and dimensions of Arbocel® are different from textile cellulosic fibres (see an example of an Arbocel® particle on a textile thread in Table 6).
As for Milan®, Cl, S and Ca appear significantly, being Cl and S an identification key of cleaning agent residues that may remain in the treated samples, as these two elements are not present in soiling (see Table 5, figure c). Traces of Al, Si, Mg and Ti are also identified. C and O is also abundant.
Akapad®Soft sponge presents C and O as the most abundant elements in the spectrometry. In addition, other elements such as F, Cl, K, S, Si are observed, the last two probably being derived from the vulcanization process. Small particles containing S and Cl are indicative, in threads of samples treated with this sponge, of cleaning material residue, as these elements are not present in the non-treated canvas, nor in the soiling.
Art Sponge® is composed of vulcanized natural rubber, so the spectrometry mainly shows C and O, followed by Ca and S, the former used very likely in the form of CaCO3 as a filling system and S as a component of the vulcanization process. Zn, Al, Si and Na are also found to a lesser extent, probably used as additives. Presence of particles containing S and large amounts of Ca in the samples treated with Art Sponge® is a sign of cleaning material residue.
Artificial dirt was also analysed in order to distinguish it from the possible traces of the cleaning materials. The elements observed in the spectra are C and O, Fe (due to iron oxide), Si (silicates, kaolinite and clay), Al (kaolinite and clay), Ca (CaCO3 from cement) and traces of K and Mg (mineral salts of the gelatine). Thus, particles in samples with artificial dirt, showing high amounts of Al and Si, accompanied with Fe and Mg are a clear indication of soiling residues.
Artificially soiled canvas samples
As shown in Table 5, artificial soiling can be easily identified in SEM images by EDX characterization. Samples with artificial dirt present soiling particles deposited between fibres and some fibres appear disordered.
In contrast to the similarities in the results obtained using the three traditional cleaning systems observed by means of the optical microscope at × 60 and × 200, in the SEM–EDX analysis the presence of particles of dirt and cleaning material residues is seen to differ with each cleaning material (Table 6).
In the sample cleaned with microblasting powdered cellulose most of the dirt particles were removed and no particles of material residues remain on the surface. This is also confirmed in the spectra (Table 6). In this sample, a few residues of Arbocel® are identified (see the particle in the circled area, image on the top). No changes or damages of the canvas were visible and we could not detect any soil particles remaining in the sample.
In the sample cleaned with Milan®, fibres were removed, folded and some of them are broken. The spectrum shows the presence of characteristic chemical elements of dirt such as Mg, Al, Si and a large amount of Ca, S and Cl, components identified in the spectra of Milan® eraser (see Tables 4 and 6) which were not present in the new canvas without the artificial dirt.
The sample cleaned with Akapad®Soft sponge has a very rough appearance. The EDX microanalysis, shows a large quantity of the main components of the sponge, S and Cl (see Tables 4 and 6).
Lastly, the sample cleaned with Art Sponge® has a less modified appearance. The spectra indicate traces of dirt particles and highlight the presence of Ca, a characteristic chemical element observed in the microanalysis of the smoke sponge (see Tables 4 and 6).
Old canvas samples
As in the artificially soiled canvas, in the old sample the particles of residues of the dirt and the cleaning materials vary according to the cleaning technique used, as shown in Table 7.
The first image (Table 7), the dirty canvas, shows a homogeneous appearance, in which the dirt is spread over the entire surface and deposited between the fibres.
In the Arbocel® cleaned sample, the dirt has mainly been evenly removed. Between the fibres, there are some traces of dirt and small deposits that, due to their appearance, seem to be traces of the canvas priming. This is also confirmed in the spectra. Fibres remain twisted and there is no significant movement.
In the case of the sample cleaned with Milan® eraser, as found in our previous analysis, a large amount of particles of residue from the eraser itself is found, as well as dirt particles that have not been removed. The spectrum again shows the presence of characteristic chemical elements of dirt such as Mg, Al, Si and a large amount of Ca, component identified in the spectra of Milan® eraser (see Table 4).
And finally, the two samples cleaned with sponges, Akapad® Soft and Art Sponge®, present similar results in so far as dirt and particles of residues of the sponges are observed trapped between the fibres of the canvas. The EDX microanalysis, shows the presence of characteristic chemical elements of dirt and a large quantity of the main components of the sponges, S and Ca (see Table 4).
Morphologically, in samples cleaned with manual techniques, the texture of the canvas was changed: the fibres were removed and some of them were folded or broken.
Spectrophotometry
Table 8 shows the results of the spectrophotometry analysis, which can also be seen in Fig. 2.
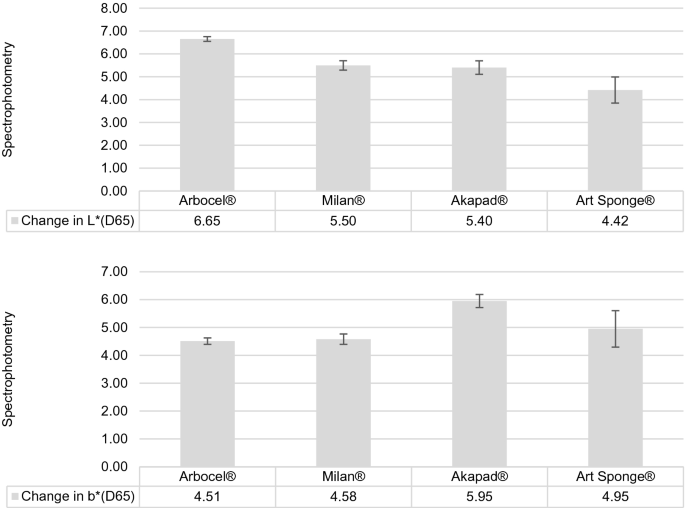
Changes in L*(D65) and b*(D65) after cleaning the old canvas. The various shades of grey range from more luminosity (lighter grey) to less luminosity (darker grey) in the first graph and from less yellow (light grey) to more yellow (dark grey) in the second
The four cleaning methods used in this study entail a substantial change in L* (D65), increasing the luminosity of the old canvas in all cases; that is, there is a cleaning effect. Values in b* (D65) are also modified by all the cleaning procedures, indicating an increase in the yellow hue. Changes in the a* (D65) coordinate are considered irrelevant.
The increase in L* (D65) can be explained by the removal of dirt, dark in tone, resulting, therefore, after cleaning, in spots of greater luminosity. However, considering that the tone of the materials used for cleaning is lighter than the old canvas (yellowish due to the oxidation of cellulose) an increase in L* (D65) could also come from the particles of residues of the cleaning materials. It seems reasonable to suppose that this is the case, at least in part, of spots treated with Milan® and Akapad®Soft sponge, where a high presence of cleaning residue particles and a lower degree of cleaning were observed in optical microscopy and SEM–EDX analysis.
Removal of dirt particles (dark in tone) increases the visibility of the fabric’s yellowish colour. Therefore, an increase in b* (D65) in all spots after cleaning was expected. However, here as well these results may have been affected by the presence of particles erasers residues and sponges (clearly identified by optical microscopy and SEM–EDX) as all of them exhibit a yellowish tone or nuance. Therefore, the greater increase in b* (D65) after using these agents does not necessarily correlate with a greater degree of cleaning; rather, it may reflect the visual change exerted by the particles of residues of cleaning materials in the asset. Thus, spectrophotometric results must be regarded in combination with electronic microscopic data to see the whole picture. In this study, spectrophotometry provides evidence of changes in colour that occur in samples derived from the cleaning effect and the possible remaining particles of residues (both soiling and/or cleaning agents), all this has been observed before with SEM and EDX.
Confocal microscopy
The topography of the canvas before and after cleaning is shown in the following confocal microscopy 3D images. These reveal lifting and movement of some fibres, removal of dirt and deposits of particles of residues of cleaning agents.
Artificially soiled samples
The first image in Table 9 shows the three-dimensional image of the new canvas surface, before applying the artificial dirt. Comparing it to the second image, we see that the application of the dirt with a soft brush reduced the maximum height of the fibres, slightly modifying the topography—from a height between yellow and blue to one between blue and green. In both images, some fibres appear raised, and are higher in the soiled canvas.
Certain differences are observed after cleaning: the sample cleaned with Arbocel® shows some raised fibres and fewer dirt particles of residues in the gaps between warp and weft compared to the others; in the second sample, cleaned with Milan® eraser, fibres appear raised in a new position, and residues of particles appear between the gaps of the canvas structure (dark blue); the third sample, cleaned with the Akapad®Soft sponge, shows many raised and displaced fibres and particles of residues in the interstices; lastly, the sample cleaned with the Art Sponge® also presents raised and moved fibres, although there are fewer particles of residues between the warp and weft gaps.
Old samples
The topography of the old canvas samples is shown in 3D images in Table 10. In all the samples (uncleaned and cleaned), some fibres appear raised (in red). This confirms that the texture of the canvas is not significantly modified with any of the cleaning methods, although, as seen in optical microscopy and SEM, traditional cleaning systems displace the fibres due to mechanical action.
As for the gaps between weft and warp, the difference in dirt and residue deposits before and after cleaning is significant. In Table 10 there are two images of the same dirty canvas in two different locations; in both, large deposits of accumulated dirt (dark blue) are visible and fibres are barely distinguished.
In the sample cleaned with Arbocel®, the dirt accumulated between the weft and the warp was removed, with the ensuing emergence of valleys. On the other hand, in the samples cleaned with traditional systems, part of soil has been removed, but traces of dirt or particles of residues accumulated in the boundary of each concavity between threads are identified. The Milan® eraser appears to be the one that leaves the most deposits (either dirt or residues of cleaning agents) followed by the Akapad®Soft sponge and lastly by the Art Sponge®.
Area roughness analysis shows differences between tests (Fig. 3). On all treated surfaces Sa and Sq increase because cleaning eliminates the smoothing of the uniform soiling layer accumulated on the reverse of the canvas.

Results of confocal laser microscopy with surface roughness measurements
Compared with the soiled surface, Sq of Milan, Akapad® and Art Sponge® are only slightly higher (± 1 μm) and Sa (± 2.5 μm). The highest increase in total height corresponds to Arbocel® (Sa ± 4 μm; Sq ± 3 μm) indicating that cleaning is more effective because more soiling is removed (as can be seen in 3D images). Sz, a parameter related to the absolute values of Sp and Sv, presents similar behaviour but in this case the Akapad® value is higher, thus indicating a significant lifting of some fibres, as can be seen in confocal images.
As regards volume parameters, Vmp and Vvv are quite similar in all the tests, suggesting that peaks and valleys remain relatively unchanged after treatment; only Alkapad® shows a higher increase. Analysing the core volume, both Vmc and Vvc have similar behaviour to Sa and Sq. However, the Vvc/Vmc ratio seems to reflect a more likely response to surface treatment, indicating that Milan, Akapad® and Art Sponge® slightly modify the soiled surface. To explain these results, the particles of residues of the product used remaining on the canvas surface and the soil modify the average of voids in the analysed area must be taken into account. The higher the values, the cleaner the surface might be; in this case Arbocel® obtains the highest values.
[ad_2]
Source link